

Market Pulse March 2026

Stocks and bonds weaken in March
Financial markets turned lower in March, as military action in the Middle East prompted broad declines in stock and bond markets. The S&P/TSX Composite Index slid 4.6% during the month, nearly erasing its early-year gains, despite the cushion of energy stocks, which had a strong month as oil prices surged.
The S&P 500 Index fell 5.1% for its biggest monthly drop since 2022, while the MSCI EAFE Index declined by 10.7%. Bond prices in Canada and the U.S. were also broadly lower as concerns of rising inflation pushed yields higher.
Markets retreat, but it’s not 2022
Financial markets over the last month may have some investors hearkening back to 2022, when both stocks and bonds sold off significantly. While there are some similar themes to 2022, it’s important to remember that, despite the similarities, it’s the differences that really matter.
Similar to 2022, geopolitical tensions are pushing oil prices higher and injecting fresh uncertainty into the outlook. We also find ourselves again in a challenging macro mix: growth is slowing, yet inflation remains sticky.
However, context matters, and there are also notable differences today compared to 2022.
Back in 2022, the federal funds rate was almost at zero (0.25%), inflation was running extremely hot at 8.50%, and many argued that, from a monetary policy perspective, the U.S. Federal Reserve (Fed) was behind the curve. Crucially, consumer essentials such as oil and food prices were rising, putting even more upward pressure on the inflation picture.
Ultimately, the Fed responded aggressively with 7 rate hikes in 2022 alone, taking policy rates to 4.5%, which eventually hit 5.5% in 2023. The U.S. 10‑year yield jumped from 1.5% to 3.9% by year‑end.
Different year, different situation
But the picture is very different today. The federal funds rate is currently 3.75%, with a bias toward cuts rather than hikes. As for inflation, it’s around 2.4% in the U.S., down from its peak above 8% in 2022. Meanwhile, the U.S. 10-year Treasury yield is around 4.3%, which we believe reflects repricing, not panic.
Are oil price shocks always a cause for concern?
Then
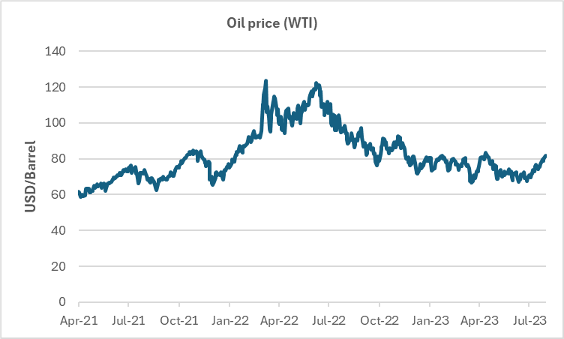 Source: Macrobond, Manulife Investments, as of 6/30/2023
Now
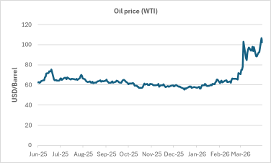
Source: Macrobond, Manulife Investments, as of 3/24/2026
The big swing factor right now
Oil. Oil. Oil.
How much higher it goes — and how long it stays elevated is likely to drive the next chapter of the story. It will influence inflation, shape the Fed’s next move, and ultimately steer market sentiment for the rest of the year. Until we get clarity there, volatility will stick around. But this isn’t 2022 — the rate environment, inflation backdrop, and policy setting look very different this time around.
Index returns as of March 31, 2026
Close | March (%) | YTD (%) | |
S&P/TSX Composite Index | 32,768.04 | -4.6 | 3.3 |
Dow Jones Industrial Average (USD) | 46,341.51 | -5.4 | -3.6 |
NASDAQ Composite Index (USD) | 21,590.63 | -4.8 | -7.1 |
S&P 500 Index (USD) | 6,528.52 | -5.1 | -4.6 |
MSCI EAFE Index (USD) | 2,838.61 | -10.7 | -1.9 |
Source: Manulife Investment Management Capital Markets Strategy Team, as of 3/31/2026
Monthly lookahead
April 3 | U.S. March employment |
April 8 | FOMC minutes (March 18) |
April 9 | U.S. February personal income and spending, U.S. Q4 GDP (final estimate) |
April 10 | Canada March employment, U.S. March CPI |
April 15 | Canada February wholesale trade, manufacturing shipments |
April 17 | Canada March housing starts, February international securities transactions |
April 20 | Canada March CPI, BoC Q1 business outlook survey |
April 24 | Canada February retail sales, U.S. University of Michigan consumer sentiment |
April 29 | BoC and Fed policy rate decisions |
April 30 | Canada February GDP, U.S. Q1 GDP (first estimate) |
Important disclosure
Investing involves risks, including the potential loss of principal. Financial markets are volatile and can fluctuate significantly in response to company, industry, political, regulatory, market, or economic developments. The information provided does not take into account the suitability, investment objectives, financial situation, or particular needs of any specific person.
All overviews and commentary are intended to be general in nature and for current interest. While helpful, these overviews are no substitute for professional tax, investment or legal advice. Clients and prospects should seek professional advice for their particular situation. Neither Manulife Investments, nor any of its affiliates or representatives (collectively Manulife Investments) is providing tax, investment or legal advice.
This material is intended for the exclusive use of recipients in jurisdictions who are allowed to receive the material under their applicable law. The opinions expressed are those of the author(s) and are subject to change without notice. Our investment teams may hold different views and make different investment decisions. These opinions may not necessarily reflect the views of Manulife Investments. The information and/or analysis contained in this material has been compiled or arrived at from sources believed to be reliable, but Manulife Investments does not make any representation as to their accuracy, correctness, usefulness, or completeness and does not accept liability for any loss arising from the use of the information and/or analysis contained. The information in this material may contain projections or other forward-looking statements regarding future events, targets, management discipline, or other expectations, and is only current as of the date indicated. The information in this document, including statements concerning financial market trends, are based on current market conditions, which will fluctuate and may be superseded by subsequent market events or for other reasons. Manulife Investment Management disclaims any responsibility to update such information.
Manulife Investments shall not assume any liability or responsibility for any direct or indirect loss or damage, or any other consequence of any person acting or not acting in reliance on the information contained here. This material was prepared solely for informational purposes, does not constitute a recommendation, professional advice, an offer or an invitation by or on behalf of Manulife Investments to any person to buy or sell any security or adopt any investment approach, and is no indication of trading intent in any fund or account managed by Manulife Investments. No investment strategy or risk management technique can guarantee returns or eliminate risk in any market environment. Diversification or asset allocation does not guarantee a profit or protect against the risk of loss in any market. Unless otherwise specified, all data is sourced from Manulife Investments. Past performance does not guarantee future results.
Manulife, Manulife & Stylized M Design, Stylized M Design, and Manulife Wealth are trademarks of The Manufacturers Life Insurance Company and are used by it, and by its affiliates, under license.